10 💻 Second Intermediate Sample Questions
Hi guys, these are the sample questions that prof Dabo gave us to exercise yourself. As you may notice most of them are open questions on very superifical theory concepts, no indeep math or heavy calculations (matrix products, dot products etc.). So please my suggestion is to review carefully the slides and just learn the basic R commands to execute analysis on a higer level! 🍀
10.1 👨🎓 2023/2024 (2nd intermediate)
Exercise 10.1 Basic Understanding:
- What does PCA stand for?
- Briefly explain the primary objective of Principal Component Analysis.
- How does PCA help in dimensionality reduction?
Exercise 10.2 Library and Data Loading:
- Which R library is commonly used for performing PCA?
- Write the command to load the library FactomineR for PCA.
- How do you read a dataset into R for PCA analysis?
Exercise 10.3 Data Preparation:
- Explain the importance of scaling or standardizing variables before applying PCA.
- Write the R command to standardize a data matrix.
Exercise 10.4 PCA Execution:
- What function in R is used to perform PCA?
- Provide the basic syntax for running PCA on a dataset named « my_data.”
Exercise 10.5 Interpretation of Results:
- How can you access the proportion of variance explained by each principal component in the following R script?
- What is the significance of the eigenvalues and eigenvectors in PCA?
Exercise 10.6 Selecting Principal Components:
- How can you determine the optimal number of principal components to retain in R?
- Write the R command to extract the loadings of principal components.
Exercise 10.7 The inertia of a centered matrix of n individuals and p quantitative variables is
- p
- The sum of variances of the p variables
- None of the responses are true
Exercise 10.8 The principal components (coordinates of the individuals) are un-correlated
- TRUE
- FALSE
Exercise 10.9 In a normed PCA, the mean eigen-values is
- 1
- 2
- 3
Exercise 10.10 Let Z be a matrix (50 rows and 4 columns) of centered and reduced quantitative data, with a correlation matrix R (of dimension 4) and three eigenvalues are 2, 1 and 0.4.
- Give the maximum number of eigen-values
- Give the remaining eigen-values
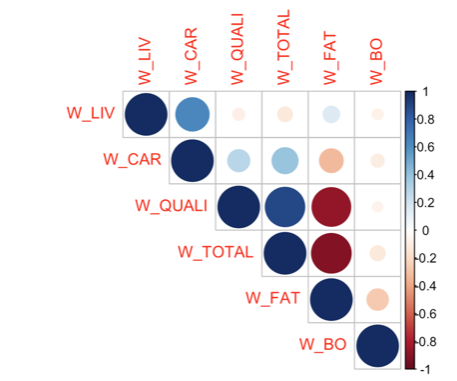
Exercise 10.11 A dataset X gives, for 23 Charolais and Zebus cattles, 6 different weights, in kg: live weight (W_LIV), carcass weight (W_CAR), prime meat weight (W_QUALI), total meat weight (W_TOTAL), fat meat weight (W_FAT), bone weight (W_BO) and the cattle type (Type).
- How do you interpret the following correlation matrix plot?
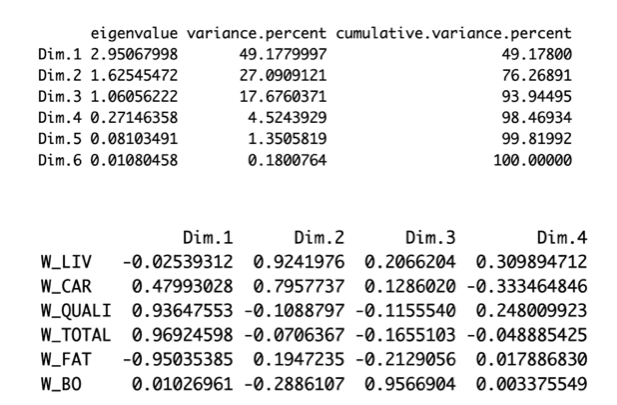
- How many components would you choose regarding the following figures (giving the eigen-values and correlation between the components and the variables)
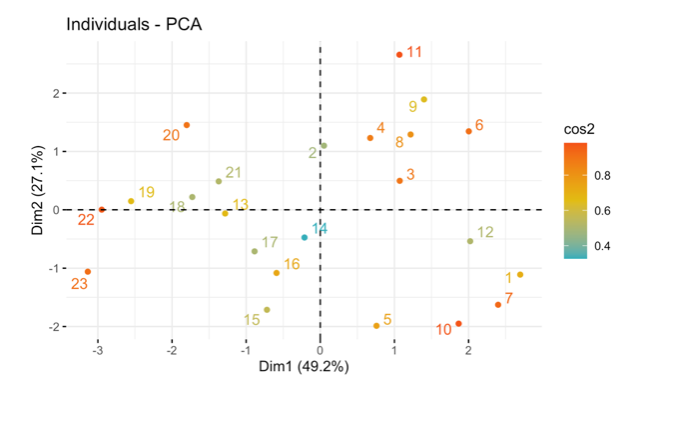
- Interpret the following figure:
Exercise 10.12 Scree Plot:
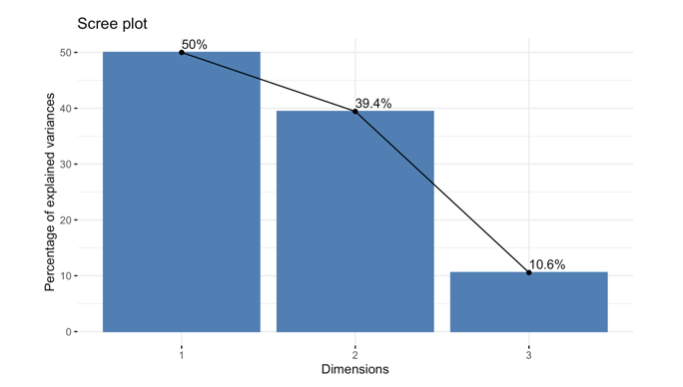
What is the purpose of a scree plot in PCA?
How do you generate and interpret the following scree plot ?
Exercise 10.13 Scree Plot:
- Briefly explain the main objective of Correspondence Analysis (CA).
- How is CA different from Principal Component Analysis (PCA)?
- Provide an example of a scenario where CA would be a suitable analysis.
Exercise 10.14 Correspondence Analysis:
- Briefly explain the main objective of Correspondence Analysis (CA).
- How is CA different from Principal Component Analysis (PCA)?
- Provide an example of a scenario where CA would be a suitable analysis.
Exercise 10.14 CA Execution:
- Provide the basic syntax for running CA on a contingency table named “my_table.”
Exercise 10.14 Interpretation of Results:
- How can you access the row and column scores of the CA results in R?
Exercise 10.15 Visualization:
- Write the R command to create a biplot for a Correspondence Analysis result.
- How can you visually assess the relationships between rows and columns in a CA plot?
Exercise 10.16 E3:
- Write the R command to extract the contributions of dimensions in CA (write it in general)
Exercise 10.17 Disjunctive table:
- Construct the disjunctive table of the following data
library(tibble) disj_table = tribble( ~Var1, ~Var2, ~Var3, “CB”, “YB”, “F”, “CB”, “YV”, “F”, “CC”, “YB”, “M”, “CC”, “YM”, “F”, “CR”, “YV”, “M”, “CB”, “YB”, “M” )
Exercise 10.18 Chi-Square Test:
- What is the role of the chi-square test in Correspondence Analysis?
- How can you perform a chi-square test on a CA result in R?
Exercise 10.19 Clustering:
- What is the main goal of clustering algorithms?
Exercise 10.20 K-Means Clustering:
- What is the fundamental concept behind K-means clustering?
- Explain the meaning of centroids in the context of K-means clustering.
- Write the R command to perform K-means clustering on a dataset named “my_data.”
Exercise 10.21 Hierarchical Clustering:
- Briefly explain how hierarchical clustering works.
- Write the R command to conduct hierarchical clustering on a dataset.
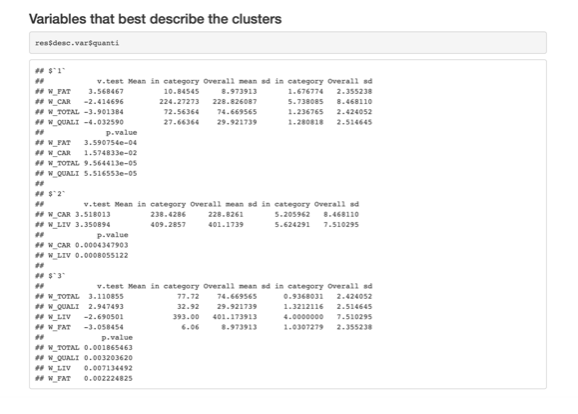
Exercise 10.22 Interpretation of Clustering Results:
- How do you interpret the following output of a clustering analysis on the cattle data?
Exercise 10.23 Classification:
- What is the main goal of a classification ?
- Provide an example of a real-world application where classification analysis could be beneficial.
- How can classification be used in medical diagnosis or fraud detection?
Exercise 10.24 What does PCA stand for?
- Primary Component Analysis
- Principal Component Algorithm
- Principal Component Analysis
- Primary Component Algorithm
Exercise 10.25 In PCA, what is the primary goal?
- Reduce dimensionality while preserving variance
- Increase dimensionality for better visualization
- Minimize all components equally
- Focus on individual components only
Exercise 10.26 Which R function is commonly used to perform PCA?
- kmeans()
- PCA()
- prcomp()
- corresp()
Exercise 10.27 What is the purpose of a scree plot in PCA?
- Visualize the clusters in data
- Assess the quality of clustering
- Evaluate the distribution of data
- Display the eigenvalues of principal components
Exercise 10.28 How do you determine the optimal number of principal components to retain in PCA?
- Use hierarchical clustering
- Examine the scree plot
- Apply k-means clustering
- Perform a chi-square test
Exercise 10.29 What is the primary application of Correspondence Analysis (CA)?
- Reducing dimensionality of numerical data
- Analyzing relationships in categorical data
- Classifying data points into clusters
- Predicting future values in a time series
Exercise 10.30 Which R library is commonly used for Correspondence Analysis?
- cluster
- caret
- ca
- factoextra
- FactomineR
Exercise 10.31 What is the role of the chi-square test in Correspondence Analysis?
- Assess the significance of relationships
- Determine the optimal number of clusters
- Evaluate the distribution of data
- Visualize the proximity between data points
Exercise 10.32 What is the primary goal of clustering algorithms?
- Dimensionality reduction
- Classification
- Grouping similar data points
- Visualization of data
Exercise 10.33 Which R function is commonly used for K-means clustering?
- hierarch()
- PCA()
- kmeans()
- prcomp()
Exercise 10.34 How can you visually assess relationships between rows and columns in a clustering plot?
- Scree plot
- Dendrogram
- Silhouette plot
- Biplot
Exercise 10.35 What is the primary goal of a classification algorithm?
- Group similar data points
- Predict numerical values
- Assign labels to data points
- Visualize high-dimensional data
Exercise 10.36 Which algorithm is commonly used for binary classification tasks? (Answers can be mnore than one)
- Decision Trees
- K-means
- LDA
- Logistic Regression
Exercise 10.37 Which metric is commonly used to evaluate the performance of a classification model?
- R-squared
- Mean Absolute Error
- Silhouette Score
- Accuracy
10.2 solutions
Answer to Question 10.7:
- p
- The sum of variances of the p variables
- None of the responses are true
Answer to Question 10.8:
- TRUE
- FALSE
Answer to Question 10.9:
- 1
- 2
- 3
Answer to Question 10.30:
- cluster
- caret
- ca
- factoextra
- FactomineR
Answer to Question 10.32:
- Dimensionality reduction
- Classification
- Grouping similar data points
- Visualization of data
Answer to Question 10.33:
- hierarch()
- PCA()
- kmeans()
- prcomp()a
Answer to Question 10.34:
- Scree plot
- Dendrogram
- Silhouette plot
- Biplot
Answer to Question 10.35:
- Group similar data points
- Predict numerical values
- Assign labels to data points
- Visualize high-dimensional data
Answer to Question 10.36:
- Decision Trees
- K-means
- LDA
- Logistic Regression
Answer to Question 10.37:
- R-squared
- Mean Absolute Error
- Silhouette Score
- Accuracy